On the 29th June there was welcome news from the UK government that it is to spend £1bn on re-building schools in England. It’s worth spending a few minutes looking behind the headlines at the detail and the scale of problem this funding is trying to tackle.
It’s a 10 year programme with the first 50 projects to be announced later this year with construction work starting in September 2021. The money for the next the nine years will be set out in the Autumn spending plan. A further £560m is to be made available for school repairs and upgrades, in addition to £1.4bn in school condition funding already committed in 2020-21.
Over the 10 years how much of the £1bn is incremental over what would have been spent anyway?** How will the funding be spent over the 10 years – front loaded/evenly/back ended?
The answers matter because the Department of Education (DfE) through its Property Data Survey Programme (PDSP) gathers data on the condition of school buildings. The National Audit Office (NAO) in 2017 reporting on the survey results commented:
“Common problems included faults with electrics, walls, windows and doors…it would take £6.7 billion to restore all schools to at least a “satisfactory” condition, and a further £7.1 billion to take them all to a “good” condition.”
This money would be split £5.5 billion for major repair works and £1.2 billion to replace parts of buildings at the end of their lives or “at serious risk of imminent failure”
So the funds announced yesterday, if spent today, would be sufficient to spend on the £1.2 billion needed in 2018 for those seriously at risk buildings.
Unfortunately buildings deteriorate over time so the above costs are out of date. The DfE while recognising the difficulties in forecasting deterioration rates projected:
“…the cost of returning all school buildings to satisfactory or better condition will double between 2015-16 and 2020-21, even with current levels of funding, as many buildings near the end of their original design life.”
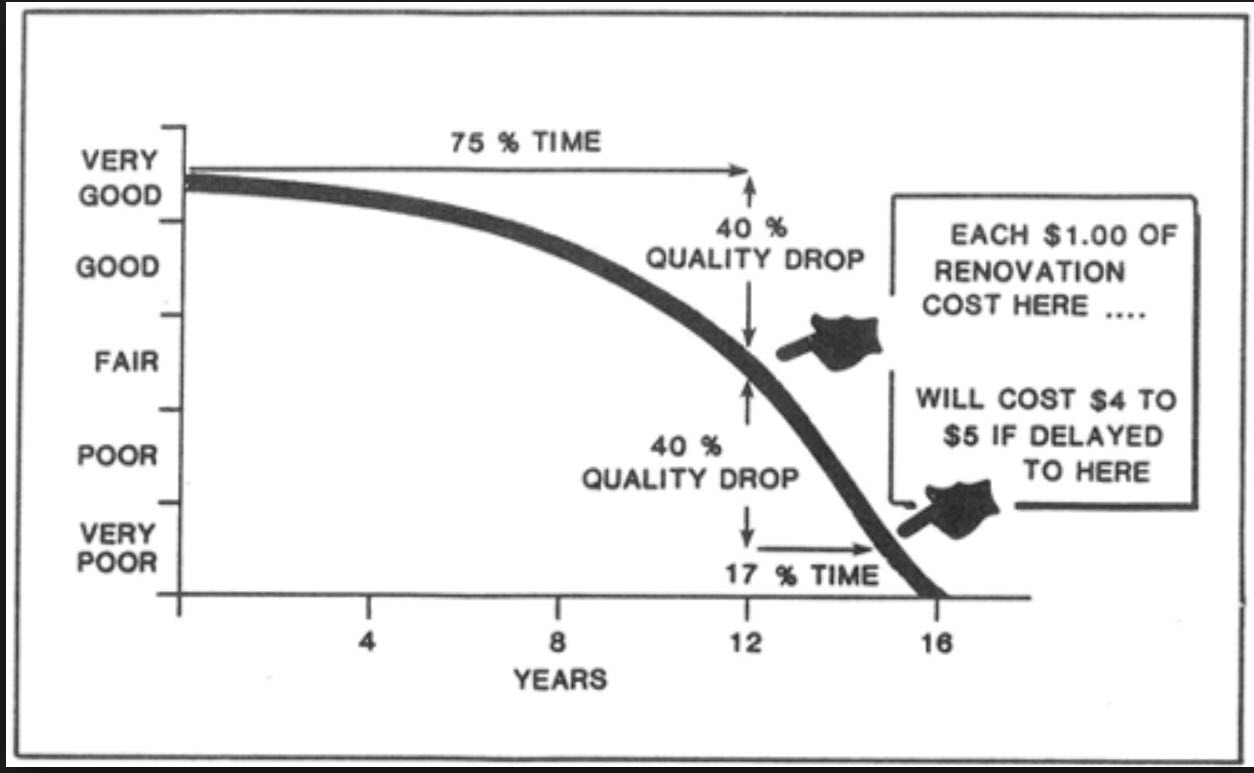
This estimate fits with generally accepted deterioration curves used in asset management as illustrated below:

Years of under funding school maintenance have exacerbated the problem such that £1bn over 10 years is nowhere near the level needed to secure a “world class” environment for children to learn in. As schools move down the condition curve you can see the ever increasing expenditure needed to get them back to a previous condition.
We need long term commitment of regular funds at sufficient levels if we’re to make headway. We need transparency in where the funds are coming from – is it new or re-purposed?
The next time you go to the pier or amusement arcade if you hit 1 in 14 moles (or given their propensity to breed more like 1 in 21 based on the above figures) would you consider that a job well done?
Footnote 1st July, 2020
Since writing the above post TES have commented on recent cuts of £760m to the DfE’s capital budget:
“In fact, Tes has learned that in April the DfE’s capital budget for 2020-21 was actually cut by £130m. And that follows an earlier cut that emerged only months earlier when the department’s capital budget was slashed by £500m.
That earlier 10 per cent cut was revealed in Treasury documents in September that showed the DfE’s capital budget was being reduced from £5bn in 2019-20 to £4.5bn for 2020-21…
Now the day after another announcement of extra money for schools, it has emerged that the DfE’s capital budget has been cut again from £4.457bn to £4.327bn.“
Learn how AltoSites estate management software can help FMs optimise their budget by simplifying the management process.

